BrightStat tips
2016-08-25
Problem with Firefox on Windows
Occasionally variables can not be selected in variable lists in BrightStat's web application. In such a case try another web-browser. Generally I recommend Chrome, Edge or Safari for BrightStat.com web application.
2016-05-12
Excel upload
You can upload your data in Microsoft Excel™ format. If this does not work, you can always export your data as a tab-delimited text file from within Microsoft Excel™ and upload the text file. This should work properly. Read more about how to prepare your data for BrightStat
2016-01-28
Presicion
By default brightstat rounds the results to five and p-values to three decimal places. If you need more presicion, just click on the the result cell in the output table.
2015-11-24
Automatic recode
Brightstat lets you recode categorical variables, often coded as strings, into ascending numbers automatically. Just select 'Automatic Recode' in the 'Data Menu' and indicate the variables to be recoded. The old values will be stored as value labels for the new numeric variable.
2015-11-03
Brightstat sample files
In the 'Data Menu' there is 'Load Sample Datafile' in the first column 'Data File'. There you'll find a list of sample files (including files for all examples on Brightstat's website). So you can start discovering Brightstat right away.
2015-09-17
Brightstat calculator
Brightstat has a built in calculator which allows you to compute new variables with existing ones. If you have measured the weight (in kg) and height (in meters) of n subjects you can easily compute the body mass index (BMI) for all subjects. If your variables are named 'weight' and 'height' the formula would be: _weight/_height^2.
The sample file 'BodyFat' contains the variables 'Weight' (pounds) and 'Height' (inches), so the formula for calculating the BMI needs some adjustment in that case: (_Weight*0.45359237)/(_Height*2.54/100)^2.
Note: In the formula a variable name is always preceded by an underscore '_'.
2015-09-03
Editing your data
Brightstat is not intended to be a data editor. Small changes can be done without problems but be aware that editing your data in Brighstat's data window may be very time consuming, especially with larger data files.
It is strongly recommended to prepare your data for Brightstat before uploading it into the database. A period '.' will be treated as a missing value.
How to prepare your data for Brightstat
2015-08-12
Set data filter
You can define a filter variable for your data. Analysis and graphs are then performed for selected cases only. Select 'Filter Data' from the menu and indicate which values of which variables should be included in the analysis.
2015-08-04
Split your datafile
You can split your datafile using a categorical variable. All tests and/or graphs are then performed for the individual categories of the split variable. Select 'Split Data' from the menu and indicate one or more split variables.
2015-07-10
Define value labels
Brightstat works best with all your variables in number format. However, for categorical variables you can define value labels. These will be used instead of the number values in output tables and graphs. In the data or the variables window select 'Define Value Labels' from the menu.
2015-07-02
Sort data
You can sort your data by clicking on the header cell of the desired variable column in the data window
2015-06-23
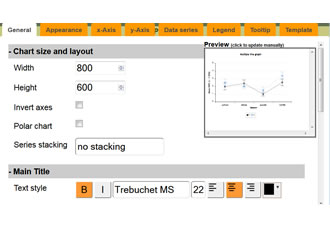
Save and reuse graph templates
In the graph edit dialogue box select 'template' and save your graph as template file. You can apply this template to all graphs of the same type, e.g. a scatterplot template can only be applied to scatterplots. Until now, templates are not stored in the database, they are active only during your current session. However, subscribers can save an output with graphs and reuse the graphs as templates in later sessions.
2015-06-11
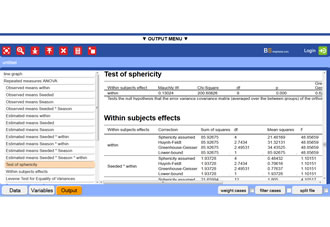
Data and output menu icons explained
| Opens the data (output) menu | |
| Toggles full screen mode | |
| zoom in (this applies to data grid, output navigation and output content windows) | |
| zoom out (this applies to data grid, output navigation and output content windows) | |
| Opens the download data (output) dialogue box (download from the database) | |
| Opens the upload data (output) dialogue box (upload into the database) | |
| Adds a row (case) on top of the data grid | |
| Enter (leave) delete row mode. As long as this is active (green) you can delete data rows by clicking on a cell of the desired row and press enter. | |
| Opens brightstat′s calculator | |
| Makes output editable. When active (green) you can edit output headers (works best on desktop computers). | |
| Enter presentation mode. Switch to full screen display of your output. |
2015-06-04
Brightstat works best (and fastest) on desktop computers with google Chrome™ or Safari® web browser.
2015-05-27
Visualizer is now available as web application for free. Click here.
2015-05-21
2015-05-14
If you happen to be a statistician and if you happen to have identical twins, don't forget to put one in the control group.
2015-05-07
You can add Brightstat's web application to the homescreen of any smartphone or tablet. (see also here)
2015-04-30
A period (.) denotes a missing value in Brightstat's web application.
2015-04-22
On mobile devices:
Use swipe right and left for moving variables to the list of selected variables and back.
Use swipe up and down for moving variables up and down in the list of selected variables.


 Donate IOTA