Two independent samples t-test
Student's t-test for two independent samples
Comparison of two means from independent samples.
Requirements:
Dependent variable is at least interval scaled and normal distributed.
Hypothesis:
Nondirectional:
H0:
H1:
Directional (example):
H0:
H1:
If  and
and  are normal distributed random variables, their difference
  is normal distributed, too. The decision between the two hypothesis is made according to the sample distribution of the mean differences.
The mean of this distribution is:
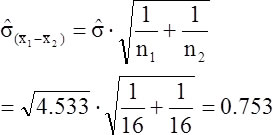
And its standard deviation is:
If homogenity of variances is assumed  it follows:
 (1)
(1)
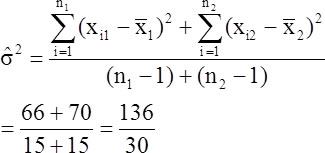
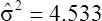
if  is unknown, it is estimated from the sample:
 (2)
(2)
(2) inserted in equation (1):
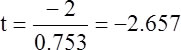
The following equation is t-distributed with df =  if
if  is estimated from the sample:
According to H0: 

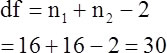
If variances are inhomogeneous df is corrected as follows:
whereas
Example of a 2 independent samples t-test
Amy is a sleepresearcher and hypothesizes that people who sleep less than 6 hours will score significantly lower than people who sleep more than eight hours on a memory consolidation test. She brings 32 participiants into her sleep lab and randomly assigns them to one of two groups. In one group she has participants sleep for more than eight hours and in the other group she has them sleep for less than six hours. All participiants have to memorize 10 different short stories before going to sleep. The next morning Amy administers the AMCT (Amy's Memory Consolidation Test) to all participiants. (Scores on AMCT range from 1 to 20 with hight scores representing better performance):
| < 6 hours | |||
 |
 |
 |
|
| 12 | 1 | 1 | |
| 12 | 1 | 1 | |
| 10 | -1 | 1 | |
| 15 | 4 | 16 | |
| 9 | -2 | 4 | |
| 11 | 0 | 0 | |
| 12 | 1 | 1 | |
| 11 | 0 | 0 | |
| 13 | 2 | 4 | |
| 9 | -2 | 4 | |
| 8 | -3 | 9 | |
| 13 | 2 | 4 | |
| 11 | 0 | 0 | |
| 13 | 2 | 4 | |
| 7 | -4 | 16 | |
| 10 | -1 | 1 | |
| Σ | 176 |
0 |
66 |
| > 8 hours | |||
 |
 |
 |
|
| 12 | -1 | 1 | |
| 13 | 0 | 0 | |
| 14 | 1 | 1 | |
| 16 | 3 | 9 | |
| 9 | - 4 | 16 | |
| 14 | 1 | 1 | |
| 10 | -3 | 9 | |
| 16 | 3 | 9 | |
| 15 | 2 | 4 | |
| 14 | 1 | 1 | |
| 13 | 0 | 0 | |
| 10 | -3 | 9 | |
| 14 | 1 | 1 | |
| 11 | -2 | 4 | |
| 12 | -1 | 1 | |
| 15 | 2 | 4 | |
| Σ | 208 |
0 |
70 |
Amy's hypothese is directional, since she expects that people with less sleep than six hours will score lower than those people with more than eight hours of sleep. Hence she will test the following hypothesis:
If she had hypothesized that the two groups do not perform equally, she would test the following non-directional hypothesis:


Testing Amy's directional hypothesis:
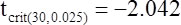
For the directional hypothesis we find that the observed t-value is smaller than the critical t-value (5%, one-sided). People with less than six hours do perform worse in Amy's Memory Consolidation Test than those with more than eight hours of sleep.
Testing the non-directional hypothesis:
For the non-directional hypothesis we find, too, that the observed t-value is smaller than the critical t-value (5%, two-sided). The two groups do differ in their performance in the AMCT.
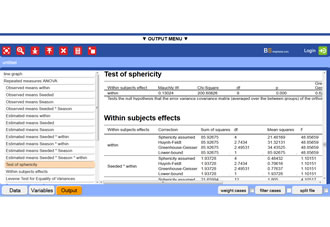
BrightStat Output of Amy's Memory Consolidation t-test example
This is a fictitious example.
Second Example of a 2 independent samples t-test
A psychologist is interested in verbal learning skills of males and females. A test reveals the following results:
| Men | |||
| |
|
|
|
| 102 | 2.5 | 6.25 | |
| 97 | -2.5 | 6.25 | |
| 104 | 4.5 | 20.25 | |
| 91 | -8.5 | 72.25 | |
| 104 | 4.5 | 20.25 | |
| 108 | 8.5 | 72.25 | |
| 93 | -6.5 | 42.25 | |
| 94 | -5.5 | 30.25 | |
| 101 | 1.5 | 2.25 | |
| 100 | 0.5 | 0.25 | |
| 89 | -10.5 | 110.25 | |
| 108 | 8.5 | 72.25 | |
| 110 | 10.5 | 110.25 | |
| 96 | -3.5 | 12.25 | |
| 99 | -0.5 | 0.25 | |
| 98 | -1.5 | 2.25 | |
| 101 | 1.5 | 2.25 | |
| 88 | -11.5 | 132.25 | |
| 104 | 4.5 | 20.25 | |
| 98 | -1.5 | 2.25 | |
| 107 | 7.5 | 56.25 | |
| 102 | 2.5 | 6.25 | |
| 104 | 4.5 | 20.25 | |
| 90 | -9.5 | 90.25 | |
| 116 | 16.5 | 272.25 | |
| 95 | -4.5 | 20.25 | |
| 99 | -0.5 | 0.25 | |
| 102 | 2.5 | 6.25 | |
| 104 | 4.5 | 20.25 | |
| 93 | -6.5 | 42.25 | |
| 100 | 0.5 | 0.25 | |
| 87 | -12.5 | 156.25 | |
| Σ | 3184 |
0 |
1428.25 |
| Women | |||
|
|
|
|
| 99 | -2 | 4 | |
| 104 | 3 | 9 | |
| 105 | 4 | 16 | |
| 95 | -6 | 36 | |
| 98 | -3 | 9 | |
| 102 | 1 | 1 | |
| 115 | 14 | 196 | |
| 102 | 1 | 1 | |
| 97 | -4 | 16 | |
| 91 | -10 | 100 | |
| 106 | 5 | 25 | |
| 108 | 7 | 49 | |
| 101 | 0 | 0 | |
| 100 | -1 | 1 | |
| 96 | -5 | 25 | |
| 95 | -6 | 36 | |
| 93 | -8 | 64 | |
| 104 | 3 | 9 | |
| 100 | -1 | 1 | |
| 107 | 6 | 36 | |
| 109 | 8 | 64 | |
| 109 | 8 | 64 | |
| 95 | -6 | 36 | |
| 97 | -4 | 16 | |
| 102 | 1 | 1 | |
| 99 | -2 | 4 | |
| 102 | 1 | 1 | |
| 104 | 3 | 9 | |
| 108 | 7 | 49 | |
| 87 | -14 | 196 | |
| Σ | 3030 |
0 |
1074 |


The observed t-value is greater than the critical t-value (5%, two-tailed). Verbal learning skills of males and females are not different.
BrightStat Output of 2 independent samples t-test example
This is a fictitious example.


 Donate IOTA