Dependent t-test
Student's t-test for paired samples (dependent)
Comparison of two means from dependent samples.
Examples for dependence:
Repeated measure, parallelized samples, virtual dependence (e.g. twins)
Requirements:
Dependent variable is at least interval scaled and normal distributed.
Hypothesis:
Nondirectional:
H0: H1:
H1:
Directional (example):
H0: H1:
H1:
The dependence of two measures from the two samples is gathered from the differences of the measurement pairs.
Mean and standard deviation of these differences  are defined as follows:

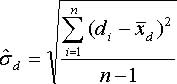
Whereas n is the number of pairs.
The decision between the hypothesis is made according to the sample distribution of  .
.
If both populations are normal distributed, the sample distribution is normal, too, with mean
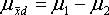
and standard deviation

If  is estimated from the sample, we get the following t-distributed equation:

with degree of freedom df = n-1.
Example of a paired samples t-test
A psychologist is interested in his new learning program. 15 Subjects learn a list of 50 words. Learning performance is measured using a recall test. After the first test all subjects are instructed how to use the learning program and then learn a second list of 50 words. Learning performance is again measured with the recall test. In the following table the number of correct remembered words are listed for both tests.
| Subject | Score 1 | Score 2 |  |
 |
| 1 | 24 |
26 |
-2 |
0.36 |
| 2 | 17 |
24 |
-7 |
19.36 |
| 3 |
32 |
31 |
1 |
12.96 |
| 4 |
14 |
17 |
-3 |
0.16 |
| 5 |
16 |
17 |
-1 |
2.56 |
| 6 |
22 |
25 |
-3 |
0.16 |
| 7 |
26 |
25 |
1 |
12.96 |
| 8 |
19 |
24 |
-5 |
5.76 |
| 9 |
19 |
22 |
-3 |
0.16 |
| 10 |
22 |
23 |
-1 |
2.56 |
| 11 |
21 |
26 |
-5 |
5.76 |
| 12 |
25 |
28 |
-3 |
0.16 |
| 13 |
16 |
19 |
-3 |
0.16 |
| 14 |
24 |
23 |
1 |
12.96 |
| 15 |
18 |
22 |
-4 |
1.96 |
| Σ | -37 |
78 |
n=15
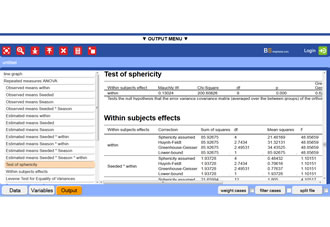
The observed t-value is smaller than the critical t-value (1%, one-tailed). The learning program has a positive effect. Subjects remember more words after the training.
BrightStat output of paired samples t-test example
This is a fictitious example.


 Donate IOTA