Dispersion
Dispersions are estimates of the variability of measurements in a given distribution.
Range
The range defines the distribution's width from the minimum to the maximum and is defined as follows:
Range = xmax - xmin
Percentiles
The n-th percentile is the value which cuts n% of the distribution.
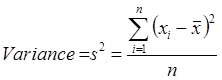
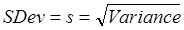
Variance and standard deviation
Variance and standard deviation are most commonly used to describe the variability of a given distribution.
Requirements:
The individual measures must be at least interval scaled.
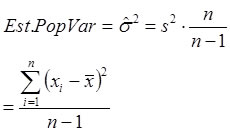
Calculation:
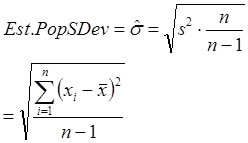
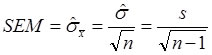
For the estimation of a population variance the variance of a sample distribution must be corrected as follows:
The same holds for the estimated standard deviation of a population
Standard error of the mean
This is a measure for the accuracy of the estimated population mean.
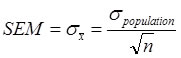
if  is estimated from the sample:
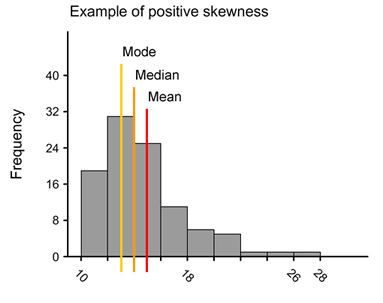
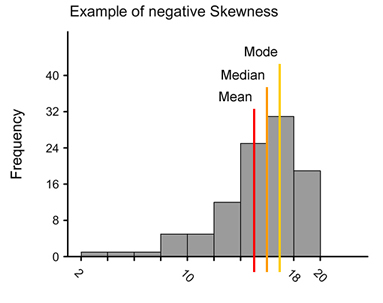
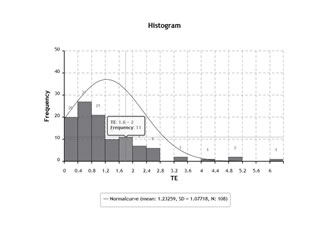
Skewness
Skewness is a measure for the symmetry of a given distribution.
A negative skew means that the left tail of the distribution is elongated (AM > Median > Mode)
A positive skew means that the right tail of the distribution is elongated (AM < Median < Mode)
Examples:
Calculation:
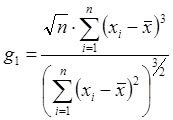
Skewness is the third standardized moment of the distribution and is computed as follows:
Sample skewness:
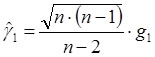
The estimation of the population skewness from a given sample is:
Kurtosis
Kurtosis is a measure of the “peakedness” of a given distribution. Higher kurtosis means more of the variance is due to infrequent extreme deviations, as opposed to frequent modestly-sized deviations.
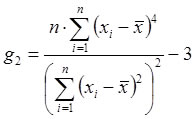
Calculation:
Sample kurtosis:
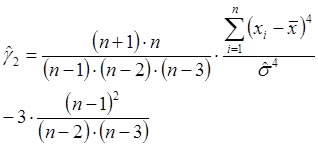
The estimation of the population kurtosis is as follows:


 Donate IOTA