BrightStat's version history
Version history
2017-05-05 v1.3.1
- Video tutorials are now embeded in the web application
- A bug has been fixed. Graphs for MANOVA and repeated ANOVA are now labeled correctly even when split file is active.
2017-03-20 v1.2.20
- Table headers fixed in some result tables
2017-03-08 v1.2.19
- Minor bugfixes
2017-03-03 v1.2.18
- Function selection fixed in graph dialogue
- I have adapted the dialogue box for column, line and area graphs with more than one variable. You can now select the desired function for the variables before adding them to the list.
2017-02-18 v1.2.17
- Brown Forsythe Test added
- I have added the Brown Forsythe test for homogeneity of variances in the following statistical procedures: MANOVA, ANOVA, Repeated ANOVA, one-way ANOVA and comparison of variances
2017-01-18 v1.2.16
- Bug fix for BrightStat Calculator
- I have fixed an error which occurred when calculating a new variable with a datafile containing more variables than cases.
2016-12-06 v1.2.15
- Bug fix for Mann Whitney U-Test
- I have fixed an error which did not address large differences in sample sizes in the Mann Whitney U-Test correctly. Exact values are now reported only if both samples are less than 9 observations.
2016-10-28 v1.2.14
- Minor bug fix for box-plot chart
- I have fixed an error in the dialogue of single boxplot graphs with separate variables. The buttons to add and remove variables to and from the list of selected variables work correctly now.
2016-09-08 v1.2.13
- Minor bug fixes for chart editor
- I have fixed some errors that occurred when positions of category elements on x axis or within pie charts were changed.
2016-08-25 v1.2.12
- Pie graphs are now available
- Graphs may now be exported to pdf and svg files. For doing this, BrightStat.com uses the exporting service of Highcharts. Please be aware of their terms of use
- Minor bugs fixed, especially in the chart editor
2016-06-08 v1.2.11
- Teachers and lecturers with an academic account may share their data files with their students. This convenient function ensures that students always have the correct data files available for the excercises.
2016-05-20 v1.2.10
- BrightStat now offers academic licenses: As a teacher or lecturer of an academic institution you may apply for your academic account and get academic licenses for the first year for your class for free.
- When signing out from BrightStat's web application, the data is now reset. If you have cached your data file locally and sign in again, your data will be automatically restored from the local cache.
- Minor bugfixes
2016-04-01 v1.2.9
- New feature added: You can now cache your working datafile on your local machine. The file will persist until the browser cache is emptied or someone else logs into BrightStat.com using the same browser on your machine (only with browsers' private mode set to off). A cached file will load automatically when BrightStat's web application is restarted. Cache datafile works only if you are logged in.
- Bugfix in MANOVA and Repeated ANOVA for factors containing missing values. When a factor contains missing values, the ANOVA, MANOVA and Repeated ANOVA will now be computed.
- Bugfix in MANOVA and Repeated ANOVA for 2-way interaction graphs. Interactions are now correctly displayed for observed and estimated means.
2016-02-25 v1.2.8
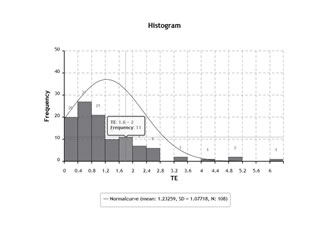
- Minor Bugfix: Display N observed values per category in simple line, column and area charts
- Amy's memory consolidation example for two independent samples t-test: Data added to BrightStat's sample data
2016-02-01 v1.2.7
- Delete Variables: You can now select variables to be deleted from your datafile.
- Rearrange Variables: You can now rearrange the variables in your datafile.
- Bugfix: Reset weight cases and split data after deletion of a datarow.
2016-01-27 v1.2.6
- Bugfix: Frequency tables now export properly when the output is stored in the database.
2016-01-22 v1.2.5
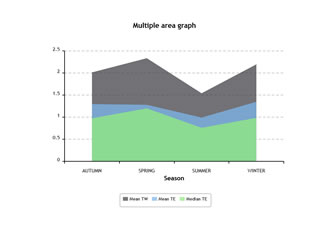
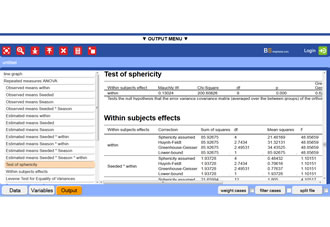
- Graph plots have been added to all ANOVA procedures. The user may now select column, line or area graphs for main effect(s) and two-way interaction(s) for observed and/or estimated means (where appropriate). Additionally errorbars may be plotted either as a confidence intervals or as standard errors.
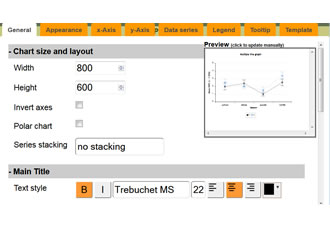
- For line, column and area graphs the possibility to change the categories' order and naming on the x-axis has been added.
- Minor bugfixes
2015-11-24 v1.2.4
- Code for missing values can now be indicated for data upload. Minor optimization for reliability procedure: faster detection of constant variables that have to be eliminated from analysis.
2015-09-26 v1.2.3
- Minor bug fixes
2015-09-09 v1.2.2
- Type I sum of squares added for ANOVA and MANOVA procedure. While a model with type III sum of squares corrects every effect against all other effects, a type I sum of squares ANOVA model corrects every effect against all previously entered effects. The order of effects entering the model affects the outcome in an unbalanced multifactorial (non equal cell n) design.
2015-09-02 v1.2.1
- Minor bugfixes for Survival plot
2015-08-27 v1.2.0
- Kaplan Meier survival analysis has been added. Inclusive tests for equality of survival functions and statistic for linear trend. Four different plots (Survival, 1-Survival, Hazard [-ln(Survival)] and ln(Survival)) are available together with customizable confidence intervals.
2015-08-12 v1.1.1
- You can now customize the crosshairs in the graph editor. Edit your graph and select the Tooltip tab and customize the X and Y portion of the crosshairs separatels. Enabling and disabling of tooltips was fixed too. Minor bug fixes in graph editor.
2015-07-08 v1.1.0
- Logistic regression implemented. Minor bug fixes.
2015-06-02 v1.0.3
- You can now print your html output and you can also send your html output to a friend. In output menu select 'get html output'
2015-05-27 v1.0.2
- On iPhones™ menu bar is hidden by the browser's adress bar, so I added a button for opening and closing the menu. Swipe down whithin the iconbar on top will also open the menu. And swipe up will close the opened menu.
- Bugfixed: function for moving variables up and down in the list of selected variables of various tests
2015-04-22 v1.0.1
- Automatic recode function added
- function for moving variables up and down in the list of selected variables of various tests
2015-04-15 v1.0.0
- Relaunch of brightstat.com as webapp
Known Issues
2015-08-12
- More graphs
- Graph Export as png or jpeg does not work on Windows® Phone


 Donate IOTA