One-sample t-test
One sample t-test
Comparison of sample mean with population mean when standard deviation of the population is estimated from the sample.
Requirements:
Dependent variable is at least interval scaled and stems from a normal distributed population.
Hypothesis:
Nondirectional:
H0:
H1:
Directional:
H0: or
or 
H1: or
or 
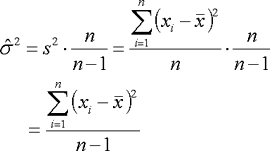
The term  is t-distributed with n-1 degrees of freedom.
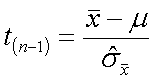
whereas
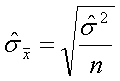
and
The obtained t-value is then compared with the critical t-value to make the decision of significance.
However, for sufficient large samples (n > 100)* one can compute the z-Value even if σ is estimated from the sample:
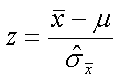
* for large samples (n > 100) the t-distribution approximates the standard normal distribution sufficiently well.
Example of a one sample t-test
A random sample of 22 fifth grade pupils have a grade point average of 5.0 in maths with a standard deviation of 0.452, whereas marks range from 1 (worst) to 6 (excellent). The grade point average (GPA) of all fifth grade pupils of the last five years is 4.7. Is the GPA of the 22 pupils different from the populations’ GPA?
| Pupil |
Grade points |
| 1 |
5 |
| 2 |
5.5 |
| 3 |
4.5 |
| 4 |
5 |
| 5 |
5 |
| 6 |
6 |
| 7 |
5 |
| 8 |
5 |
| 9 |
4.5 |
| 10 |
5 |
| 11 |
5 |
| 12 |
4.5 |
| 13 |
4.5 |
| 14 |
5.5 |
| 15 |
4 |
| 16 |
5 |
| 17 |
5 |
| 18 |
5.5 |
| 19 |
4.5 |
| 20 |
5.5 |
| 21 |
5 |
| 22 |
5.5 |
| Mean |
5.0 |
| Variance |
0.2045 |
We estimate the standard deviation of the population:
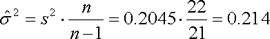
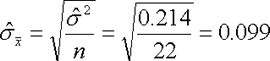
and we get the standard deviation of the mean:
now we can compute the t-value:
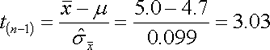
for the non directed Hypothesis we have a critical t-value of t(df=21, alpha=0.05)=2.080
for the directed Hypothesis we have a critical t-value of t(df=21, alpha=0.05)=1,721
The obtained t-value is greater that the critical t-value. The grade point average of the 22 pupils is different from the populations’ GPA.
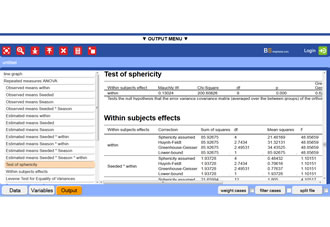
BrightStat output of one sample t-test example
This is a fictitious example.


 Donate IOTA